
Every CEO eventually asks the same question in some form: where is the team's effort actually going, and what is it buying us? It usually surfaces during budget season, or the week after a hire request lands, or when two teams with the same headcount ship at visibly different speeds.
The instinct is to go find a number. That instinct is right. The trouble is that most of the numbers on offer measure presence rather than output, and the tools that promise the most granular numbers are the ones most likely to damage the thing you are trying to improve.
This is a practical guide to measuring employee productivity as an operator: what the three layers of measurement are, how to put a currency figure on your meeting load, how to build one worked ROI case, and where the line sits between measurement and surveillance. We build Routines, a Mac app with a team activity dashboard, so we have a position in this market. The method below works with a spreadsheet and no software at all, and the last section is where our tool fits.
Why activity metrics lie to CEOs
Hours logged, messages sent, commits pushed, tickets touched. These are the metrics that are easiest to collect, which is exactly why they dominate dashboards, and they share one flaw: they measure the exhaust, not the engine.
Three specific failure modes are worth naming, because you will see all three:
They reward the wrong behaviour the moment people know they exist. A metric that can be gamed will be gamed, not out of malice but because people optimise for what is visible. Count commits and you get more, smaller commits. Count hours in a tool and you get the tool left open. This is Goodhart's law arriving on schedule.
They flatten work that is not flat. Two engineers can log identical hours while one spends the week on a migration that removes a category of future bugs and the other spends it on a feature nobody asked for. An activity metric cannot tell them apart. A CEO who only looks at activity will conclude that the two weeks were equal, and will be wrong in the most expensive possible direction.
They ignore the cost side entirely. Activity metrics are a numerator with no denominator. Twelve meetings is not a number, it is half of one. Twelve meetings costing 5,400 euro of salaried time is a number you can make a decision about.
None of this means measurement is futile. It means the useful measurement sits one level up, at outcomes and cost, rather than at keystrokes and minutes.
The three layers of employee productivity metrics worth your time
Almost everything genuinely useful falls into three layers. They answer different questions and you need all three, in this order.
Layer 1: work output, or what actually got finished
This is the layer that answers "did the work land". At the team level, the countable artefacts are usually:
- Meetings held, and how long they ran
- Decisions recorded, or their proxy, documents and specs closed out
- Tasks and to-dos completed
- Automated jobs and scheduled work that ran successfully, and how often they failed
- Whatever your business ships: releases, campaigns, deals, tickets resolved, invoices sent
The discipline here is to count completions, not starts. A backlog of forty in-progress items and a backlog of forty closed items are opposite signals that look identical on most boards.
Layer 2: where the time goes
Layer 1 tells you what came out. Layer 2 tells you what went in, and it is the layer most companies skip because the honest version is harder to collect than the dishonest one.
The useful resolution is the category, not the document. You want to know that the team spent 31 percent of its tracked hours coding and 15 percent in meetings this month, and which repositories or projects absorbed the coding time. You do not need to know which file, which sentence, or which website. That extra resolution is where the risk lives and it almost never changes a decision.
The best version of this layer is passive. If somebody has to start and stop a timer, you are measuring their discipline with timers rather than their work.
Layer 3: cost and ROI
This is where the first two layers become a business conversation. It requires exactly one input that most companies already have: a fully loaded hourly cost per role. Salary, plus employer taxes and benefits, plus overhead like tooling and space, divided by working hours per year.
With that one number, everything in layers one and two converts to currency:
- Time in a category becomes a spend line
- A meeting becomes a purchase with a price
- An outcome becomes a cost per outcome
- An automation becomes a return you can defend
The point is not to bill your team internally. It is that a CEO cannot compare "a lot of meetings" against "a hiring request" until both are in the same units.
The cost of meetings, with the math
Meetings are where the biggest, most visible number usually hides, and they are the easiest thing to price. You do not need a meeting cost calculator, you need one line of arithmetic:
Attendees x fully loaded hourly rate x duration in hours = cost per meeting.
Multiply by occurrences per year for the recurring ones. Assume 46 working weeks to account for holidays and leave.
Worked example, with the assumptions stated so you can substitute your own:
| Meeting | Attendees | Loaded rate | Duration | Per session | Per year |
|---|---|---|---|---|---|
| Weekly team sync | 6 | 75 euro | 1 hour | 450 euro | 20,700 euro |
| Weekly leadership | 4 | 120 euro | 90 min | 720 euro | 33,120 euro |
| Monthly all hands | 30 | 70 euro | 1 hour | 2,100 euro | 25,200 euro |
Three recurring meetings, 79,020 euro a year. Nobody signed a purchase order for that.
Two things to do with this number, neither of which is "cancel all meetings":
Compare it against the alternative. If the weekly team sync is what stops three people from building the same thing twice, 20,700 euro is cheap. If it exists because it has always existed, you just found the budget for a contractor.
Attack the inputs, not the meeting. The cost is linear in attendees and in duration. Cutting the sync from 60 to 40 minutes saves 6,900 euro a year. Making four of the six optional saves more than that. This is a far easier conversation to have when it is a currency figure rather than a preference.
A worked ROI example
Take one concrete case: the weekly status report. Say five team leads each spend 45 minutes on a Friday assembling what their team shipped, at a loaded rate of 90 euro an hour.
- Per week: 5 x 0.75 hours x 90 euro = 337.50 euro
- Per year, at 46 weeks: 15,525 euro
Now suppose that report is drafted automatically from the week's meetings, completed tasks and notes, and each lead spends 10 minutes reviewing and correcting it instead of 45.
- New per week: 5 x 0.17 hours x 90 euro = 76.50 euro
- New per year: 3,519 euro
- Recovered: about 12,000 euro of leadership time a year
Five seats of tooling at 20 euro a month is 1,200 euro a year. The case is not close, and it survives being wrong by half.
This is the shape every productivity investment should be argued in: a specific recurring task, its current cost in currency, its cost after the change, and the price of the change. If you cannot fill in those four boxes, the initiative is a preference rather than a business case.
The surveillance trap
There is a whole category of tooling that will offer you far more resolution than anything above: keystroke counts, periodic screenshots of employee monitors, idle detection, per website and per document time, productivity scores per person per hour.
Two problems, one practical and one strategic.
The practical one is that the extra resolution rarely changes a decision. Knowing that someone typed 4,000 keystrokes on Tuesday tells you nothing about whether the work was good. Knowing which article they read at 15:40 tells you nothing you can act on. You end up with a much larger dataset and the same handful of decisions in front of you.
The strategic one is more expensive. The moment people know their screen is being captured, two things start immediately: they optimise for the observer, and the most mobile people on your team start taking calls from recruiters. You are trading a small amount of measurement signal for a large amount of discretionary effort, and discretionary effort is the entire difference between a team that meets its number and a team that beats it.
The rule that holds up: measure metadata, not content. How long, how many, which category, what outcome. Not what was typed, said, or read. Almost every question a CEO actually needs answered lives on the metadata side of that line, and staying on that side is what makes the measurement survivable when you tell the team it exists. Which you should, before you turn it on.
Team productivity metrics your team will accept
A short list that works in most knowledge-work companies, and that you can explain in a company meeting without anyone flinching:
- Completed outcomes per period, at team level. Whatever "done" means for that team, counted, with the definition written down.
- Meeting load in hours and in currency. Per team, per month, trended.
- Time by category. Coding, meetings, communication, writing, and so on. Team-level percentages, not individual rankings.
- Cost per outcome. The layer-three number that turns the first two into a comparison you can act on.
- Automation coverage. How much recurring work runs without a human starting it, and how often it fails.
Two rules make the difference between a dashboard people use and one they resent. First, no individual leaderboards. A per-person ranking converts a measurement tool into a performance review nobody agreed to. Second, whoever is measured gets to see the definition and gets a say in whether they are measured at all.
How Routines measures this for Mac teams
Routines is a Mac app that runs scheduled AI jobs, records and transcribes meetings, keeps a local memory of your work and tracks to-dos. On the Teams plan it also produces the dashboard below, which is our attempt at layers one and two without crossing into layer-zero surveillance.
The screenshots are real screens from the Teams console, seeded with a demo team so no real names or work appear in them.
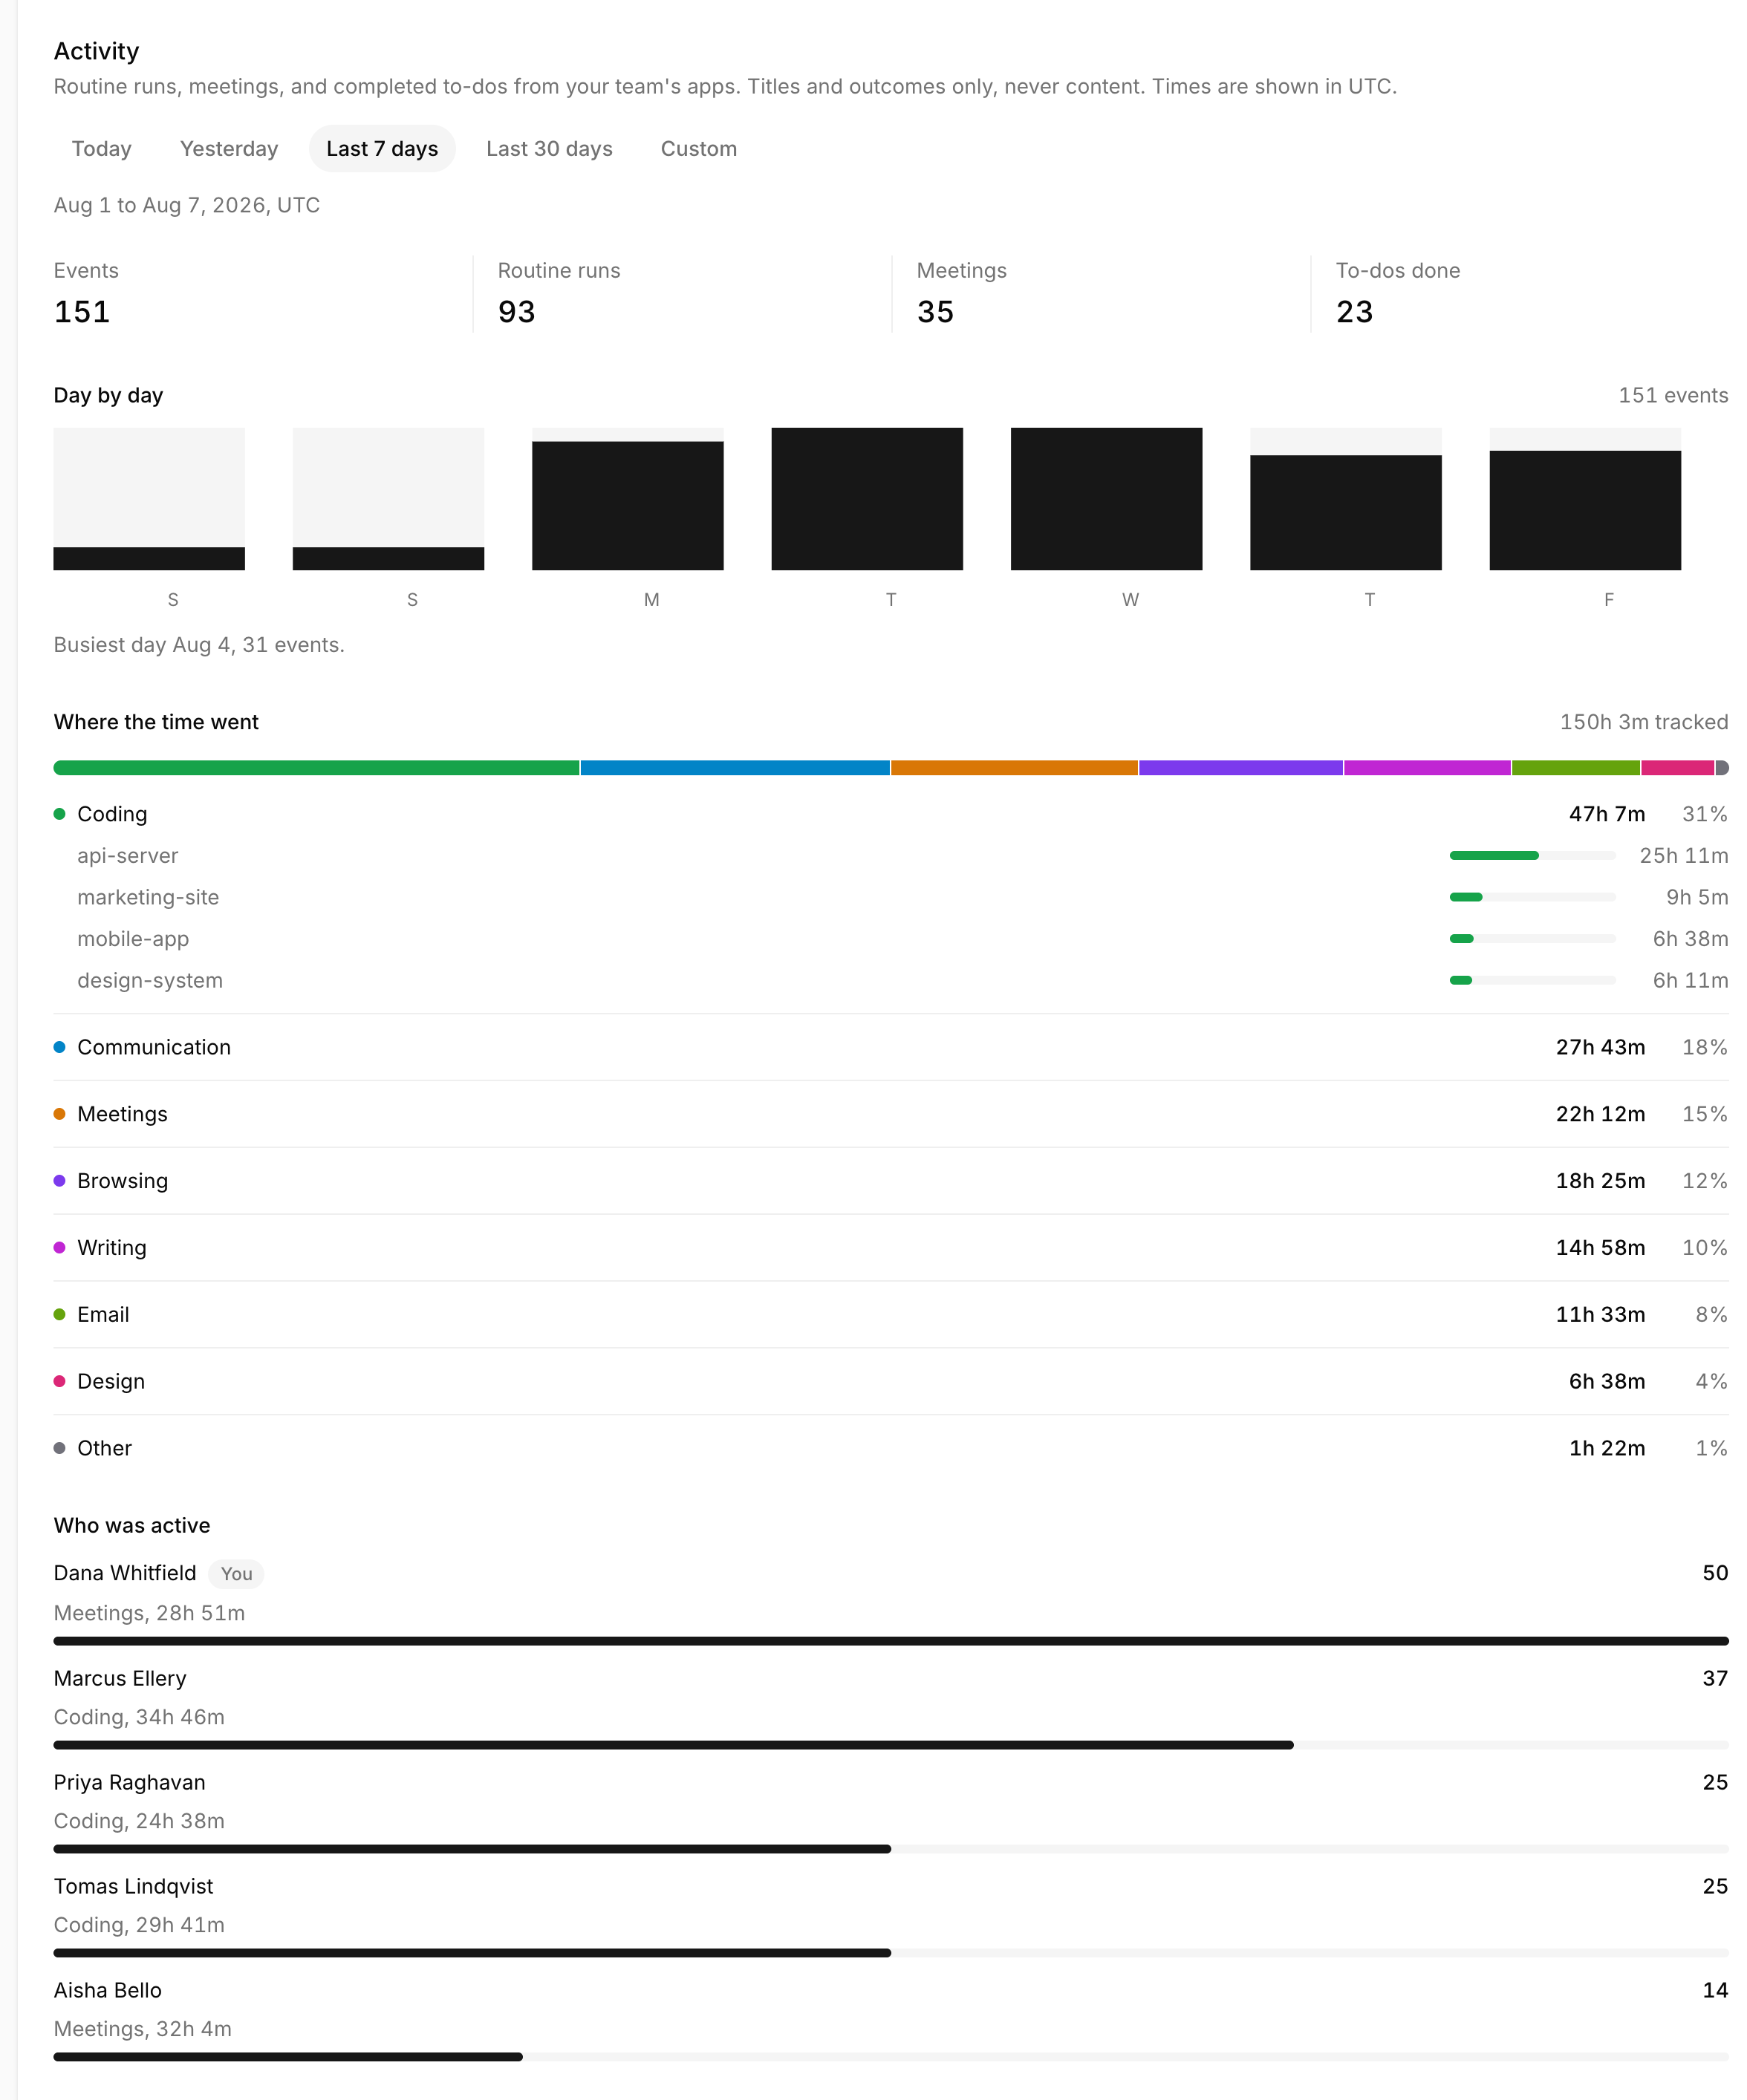
Layer one, work output. The dashboard counts exactly three kinds of finished work: routine runs, meetings recorded, and to-dos completed. Each event carries who, what kind, a title, whether it succeeded or failed, how long it took and when. There is no field for the output of a routine, the body of a to-do or the text of a transcript, so none of that can travel even by accident.
Layer two, where the hours went. The Mac app watches which app is in front locally, and roughly every ten minutes it sorts those sessions on the device into eight categories: Coding, Communication, Browsing, Meetings, Design, Email, Writing and Other. For coding it also lifts a repository name out of IDE and terminal window titles when the title makes it unambiguous, which gives you coding time per repository without installing an editor plugin on anyone's machine.
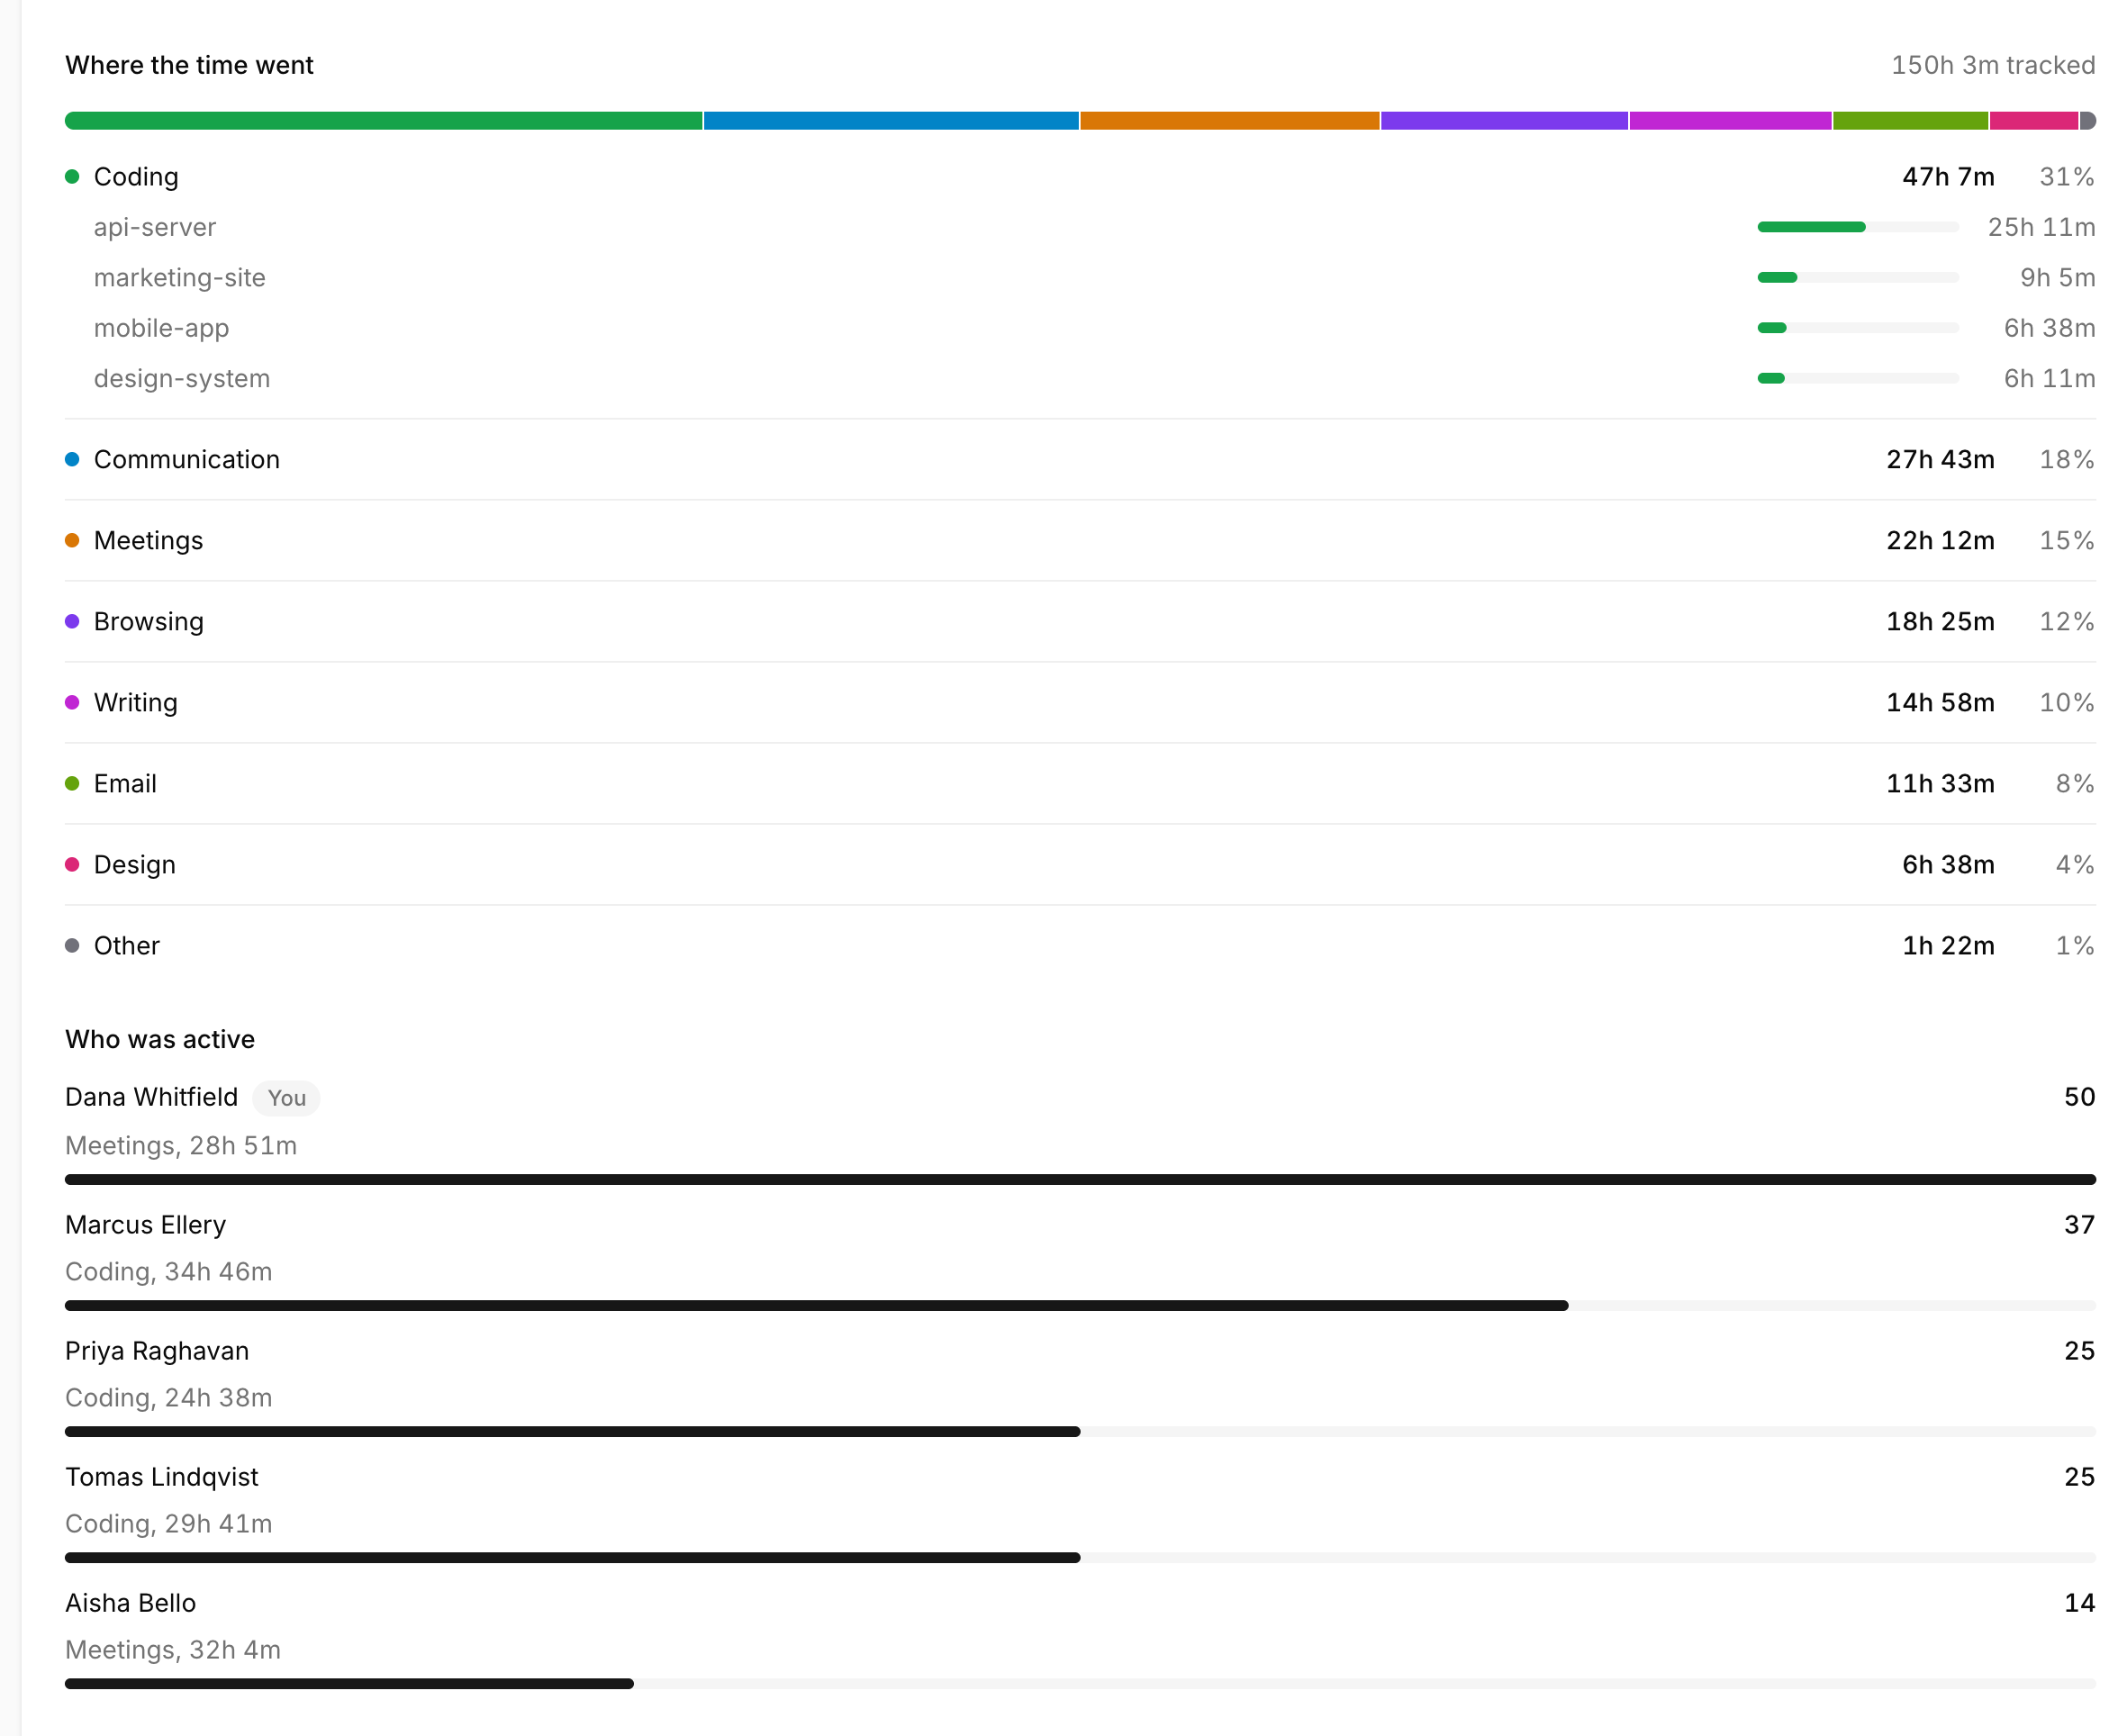
The privacy boundary is a design constraint rather than a setting: window titles, URLs and browser domains are classified on the Mac and discarded there. What leaves the machine is a category, an app name, an optional repository name, a number of seconds and an hour. Browser time arrives as one Browsing bucket, never as a list of sites.
Three more things worth knowing before you consider it:
- The dashboard is owner-only. Team members do not see each other's activity, and they do not see the dashboard at all.
- Each person controls sharing from their own Mac. There are two switches in their app, one for activity and one for app usage. Off means nothing is sent, and turning it on starts from that moment. There is no backfill of history nobody was asked about.
- It is a paid tier. Teams is 20 euro per seat per month, or 160 euro per seat per year, tax inclusive, minimum two seats, with a 14-day trial.
For layer three, the cost math stays yours. Read the hours off the dashboard, apply your loaded rates, and you have the meeting and category spend lines from the sections above without anyone assembling them by hand on a Friday. If you want the same weekly summary written for you, the Weekly Report recipe drafts shipped, in progress and next week from your own meeting notes and memory every Friday afternoon.
Meetings are usually the first place the numbers move, and meeting notes that write themselves remove the write-up cost from every call before you have cancelled a single one. If you came here specifically from developer time tracking, the comparison with WakaTime sets out what each tool measures and where each one is genuinely better.
Start with the meeting arithmetic this week. It takes twenty minutes, it needs no software, and it is usually the number that changes the conversation. Download Routines when you want the counting to happen on its own.
FAQ
How do you calculate employee productivity?
The standard formula is output divided by input: units of work produced divided by the hours or the cost that produced them. For knowledge work the honest version is a ratio you define yourself, for example deals closed per sales hour, tickets resolved per support seat, or releases shipped per engineering month. The formula matters less than holding the definition still for a few quarters so the trend means something.
What are the 4 P's of productivity?
There is no single canonical list, which is worth knowing before you build a dashboard around one. The most widely used version is Purpose, People, Process and Performance: why the work exists, who does it, how it flows, and what it produces. It is a diagnostic framing for finding where output is lost, not a set of metrics you can chart.
What is the best way to track employee productivity?
Measure outcomes at the team level and time at the category level, and stop there. Outcomes tell you whether the work is landing. Category level time tells you where the hours go without anyone reading a document title. Individual, content level monitoring buys you very little signal and costs you trust, which is the more expensive of the two.
What is a good employee productivity rate?
There is no cross industry number worth quoting, and any vendor who gives you one is selling a benchmark they cannot support. The only useful rate is your own baseline: measure the same ratio the same way for one quarter, then judge every later quarter against it. A team that improves its own number by ten percent has told you something real. A team that hits an imported industry average has told you nothing.
Can you measure productivity without monitoring what people write?
Yes, and it is the more useful measurement. Metadata answers most CEO questions: how many meetings happened, how long they ran, how many tasks closed, which category the hours fell into. The content of a document, an email or a transcript almost never changes a staffing or budget decision, so collecting it adds risk without adding signal.
How much does a weekly meeting actually cost?
Multiply the number of attendees by their fully loaded hourly cost by the length of the meeting, then by the number of times it runs a year. Six people at 75 euro an hour in a weekly one hour meeting is 450 euro per session and about 20,700 euro a year at 46 working weeks. That is a real line item, and it is usually the first number that changes behaviour in a leadership meeting.